Measuring Upside
Article
by Sandy Mandel
Since the implementation of the Tenant Protection Act (TPA) in June 1998, units that are vacated by existing tenants can now be rented at prevailing market levels. While there has been a continuing improvement in rental market conditions, the benefits have not be spread evenly across the market. Building that have rent structures that were suppressed by the former rent control system are achieving substantial gains whereas buildings with market rent structures have not derived any real benefits.
The key criterion in evaluating an apartment building is its income generating capability. In this regard, the rent structure is foremost in the minds of most investors. A building with all of its units more or less at market levels has a flat trajectory. In this scenario, rental growth is produced by inflationary pressure in the overall rental market. A building with this type of rent structure has a stable profile with no real growth potential. In fact, cash flow may be at risk if operating expenses rise at a rate that is greater than the general rate of rent inflation, or if unforeseen capital expenditures are required.
The more interesting scenario is that of a building with a suppressed rent structure and a raising rent trajectory. As an example, take a 50 suite building in a prime location. In some 1960’s era low-rise buildings, the rents had been trapped at low levels when rent controls were introduced in the mid-1970s. Independent owners did not aggressively pursue rent increases and it is not uncommon to find rent levels as low as $600 for 1-bedroom units. Given that market rents are now in the $950 range, a building with this rent structure presents tremendous upside.
The question is: How do you measure this upside? As an appraiser, and in quantifying this upside, “The Internal Comparison” tool is used for measuring upside. It compares the total monthly rent to the rent levels that have been achieved on recent apartment turnovers.
Continuing with the 50-suite example, we will assume that it has a current total monthly rent of $36,750. In the past six months, two bachelor units were rented at $700, two 1-bedroom units were rented at $950, and one 2-bedroom suite was rented at $1,150. These rent levels are applied to the suite mix as follows:
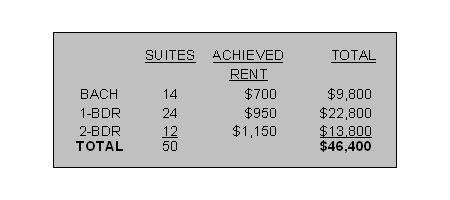
As illustrated on the chart above, a total monthly rent of $46,400 is reflected when the rent levels that have been achieved on recent turnovers are applied to the suite mix. This exceeds the actual monthly rent of $36,750 by about 26%.
This “Internal Comparison“ presents the ability to measure the growth potential that exists within a rent structure of a given building. This simple tool provides a method for quantifying growth.
To contact Sandy Mandel or to know more about the upside in your building:
Tel: 416-489-4883
Fax: 416-487-9539
E-mail: [email protected]
Back to Articles Menu
-
Mailing Address
220 Duncan Mill Road, Suite 419
Toronto, Ontario, M3B 3J5
-
Phone
(416) 444-6545
Fax
(416) 444-6997

-
Email
[email protected]

